
Fayl:NSIDC arctic sea ice extent since 1979.svg

Size of this PNG preview of this SVG file: 800 × 533 piksel. Boshqa oʻlchamlari: 320 × 213 piksel | 640 × 427 piksel | 1 024 × 683 piksel | 1 280 × 853 piksel | 2 560 × 1 707 piksel | 810 × 540 piksel.
Asl fayl (SVG fayl, asl oʻlchamlari 810 × 540 piksel, fayl hajmi: 37 KB)
Qisqa izoh
| Taʼrif |
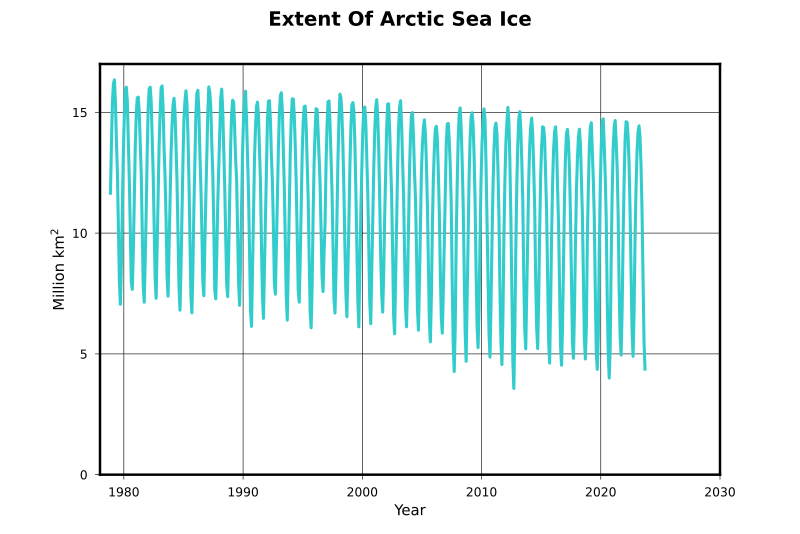
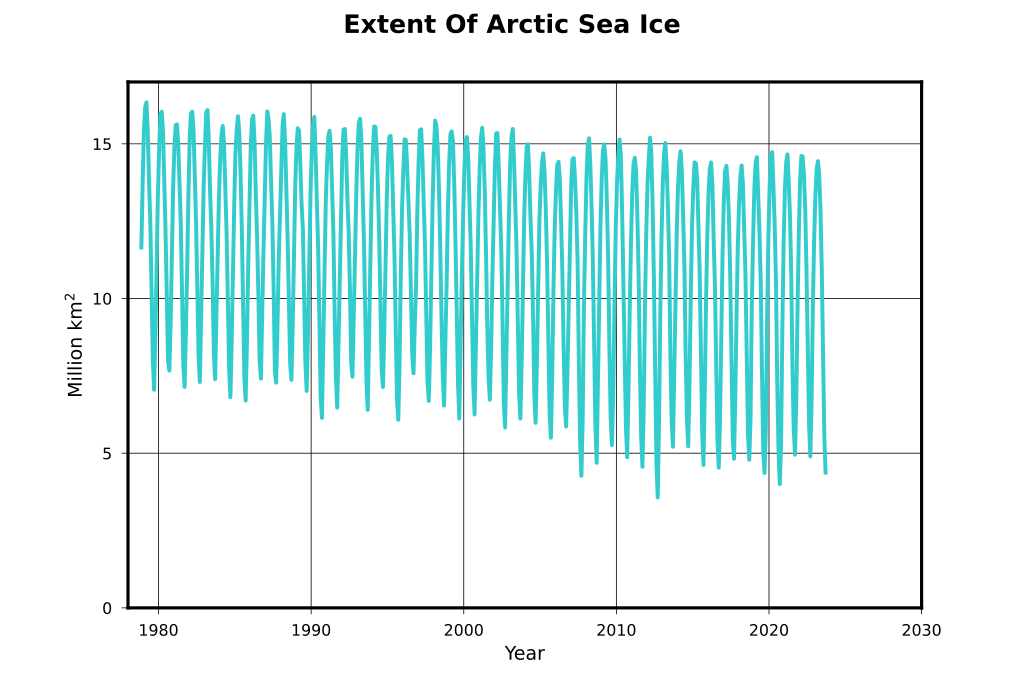
English: Plot of arctic sea ice extent development between 1979 and 2023 in monthly mean values. For the determination of the "area" value, every pixel with a sea ice concentration > .15 is taken. The pixel area is multiplied with the concentration value derived from the passive infrared signal. For the "extent" value, the concentration value is taken as 1, so we basically get full area with >.15 concentration.
Deutsch: Verlauf der Umrissfläche des arktischen Meereises in Monatsmittelwerten von 1979 bis 2023. Für die "area"-Daten werden alle Pixel mit einer Eiskonzentration > 0.15 genommen und deren Fläche mit der Eiskonzentration multipliziert. Für die "extent"-Daten wird diese Eiskonzentration =1 gesetzt - so erhält man die Gesamtfläche mit überhaupt irgendwelchem Eis. |
| Sanasi | |
| Manba | Oʻzimning ishim |
| Muallif | Dominiklenne |
Data source: Fetterer, F., K. Knowles, W. Meier, and M. Savoie. 2002, updated until 2010. Sea Ice Index. Boulder, Colorado USA: National Snow and Ice Data Center. Digital media. ftp://sidads.colorado.edu/DATASETS/NOAA/G02135/. Corresponding website: http://nsidc.org/data/seaice_index/archives/index.html
For the area definition see: https://nsidc.org/learn/ask-scientist/what-difference-between-sea-ice-area-and-extent
Litsenziyalash
| I, the copyright holder of this work, release this work into the public domain. This applies worldwide. In some countries this may not be legally possible; if so: I grant anyone the right to use this work for any purpose, without any conditions, unless such conditions are required by law. |
Fayl tarixi
Faylning biror paytdagi holatini koʻrish uchun tegishli sana/vaqtga bosingiz.
| Sana/Vaqt | Miniatura | Oʻlchamlari | Foydalanuvchi | Izoh | |
|---|---|---|---|---|---|
| joriy | 17:48, 23-Oktyabr 2023 | | 810 × 540 (37 KB) | Dominiklenne | update to october 2023 |
| 21:07, 9-May 2023 |  | 810 × 540 (37 KB) | Dominiklenne | update to april 2023 | |
| 19:12, 4-Mart 2022 |  | 810 × 540 (36 KB) | Dominiklenne | update until february 2022 | |
| 00:39, 7-Noyabr 2020 |  | 810 × 540 (42 KB) | Dominiklenne | update until october 2020 | |
| 17:16, 27-Oktyabr 2019 |  | 810 × 540 (45 KB) | Dominiklenne | data added until september 2019, year scale extended to 2030 | |
| 22:35, 30-Oktyabr 2018 |  | 810 × 540 (47 KB) | Dominiklenne | data updated until september 2018 | |
| 22:44, 8-Iyul 2017 |  | 810 × 540 (47 KB) | Dominiklenne | data updated until june 2017 | |
| 21:43, 22-Iyul 2016 |  | 810 × 540 (47 KB) | Dominiklenne | data updated until june 2016 | |
| 21:43, 27-Avgust 2015 |  | 810 × 540 (40 KB) | Dominiklenne | minor y scale change to the same as in https://commons.wikimedia.org/wiki/File:Plot_arctic_sea_ice_area.svg | |
| 17:03, 27-Avgust 2015 |  | 810 × 540 (40 KB) | Dominiklenne | update until 2015 / 07. Use of python matplotlip pyplot instead of Gnumeric. Slightly different y-scale for better exhaustion of plot area. |
Fayllarga ishoratlar
Bu faylga bogʻlangan sahifalar yoʻq.
Faylning global foydalanilishi
Ushbu fayl quyidagi vikilarda ishlatilyapti:
- ar.wikipedia.org loyihasida foydalanilishi
- bn.wikipedia.org loyihasida foydalanilishi
- de.wikipedia.org loyihasida foydalanilishi
- en.wikipedia.org loyihasida foydalanilishi
- fa.wikipedia.org loyihasida foydalanilishi
- fr.wikipedia.org loyihasida foydalanilishi
- it.wikipedia.org loyihasida foydalanilishi
- ko.wikipedia.org loyihasida foydalanilishi
- la.wikipedia.org loyihasida foydalanilishi
- mk.wikipedia.org loyihasida foydalanilishi
- nn.wikipedia.org loyihasida foydalanilishi
- no.wikipedia.org loyihasida foydalanilishi
- sq.wikipedia.org loyihasida foydalanilishi
- sv.wikipedia.org loyihasida foydalanilishi
- uk.wikipedia.org loyihasida foydalanilishi
- zh.wikipedia.org loyihasida foydalanilishi