
Fayl:1880- Global average sea level rise (SLR) - annually.svg

Size of this PNG preview of this SVG file: 800 × 450 piksel. Boshqa oʻlchamlari: 320 × 180 piksel | 640 × 360 piksel | 1 024 × 576 piksel | 1 280 × 720 piksel | 2 560 × 1 440 piksel | 1 200 × 675 piksel.
Asl fayl (SVG fayl, asl oʻlchamlari 1 200 × 675 piksel, fayl hajmi: 6 KB)
Qisqa izoh
| Taʼrif |
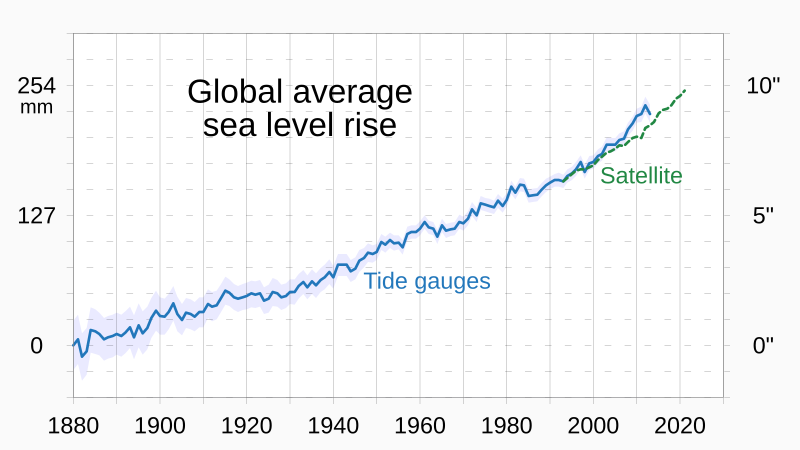
English: Chart showing global average sea level rise (SLR), annually
|
||
| Sanasi | |||
| Manba | Oʻzimning ishim | ||
| Muallif | RCraig09 |
_-_annually.svg)
_-_annually.svg)
_-_annually.svg)
Litsenziyalash
I, the copyright holder of this work, hereby publish it under the following license:
This file is licensed under the Creative Commons Attribution-Share Alike 4.0 International license.
- Siz erkinsiz:
- ulashishga – ishlanmani nusxalash, tarqatish va uzatish
- remiks qilishga – ishni moslashtirishga
- Quyidagi shartlar asosida:
- atribut – Siz tegishli litsenziyaga havolani taqdim etishingiz va oʻzgartirishlar kiritilganligini koʻrsatishingiz kerak. Siz buni har qanday oqilona yoʻl bilan qilishingiz mumkin, lekin litsenziar Sizni yoki Sizning foydalanishingizni ma'qullashini taklif qiladigan tarzda emas.
- bir xil ulashish – Agar Siz materialni remiks qilsangiz, oʻzgartirsangiz yoki unga asoslansangiz, oʻz hissalaringizni asl nusxadagi kabi bir xil yoki mos litsenziya ostida tarqatishingiz kerak.
Fayl tarixi
Faylning biror paytdagi holatini koʻrish uchun tegishli sana/vaqtga bosingiz.
| Sana/Vaqt | Miniatura | Oʻlchamlari | Foydalanuvchi | Izoh | |
|---|---|---|---|---|---|
| joriy | 17:13, 28-Oktyabr 2023 | | 1 200 × 675 (6 KB) | RCraig09 | Version 2: place international units on left axis, per suggestion on Talk Page |
| 05:53, 26-Oktyabr 2023 |  | 1 200 × 675 (6 KB) | RCraig09 | Uploaded own work with UploadWizard |
Fayllarga ishoratlar
Bu faylga bogʻlangan sahifalar yoʻq.
Faylning global foydalanilishi
Ushbu fayl quyidagi vikilarda ishlatilyapti:
- bn.wikipedia.org loyihasida foydalanilishi
- cs.wikipedia.org loyihasida foydalanilishi
- en.wikipedia.org loyihasida foydalanilishi
- ko.wikipedia.org loyihasida foydalanilishi
_-_annually.svg)